
A Post-mortem on the Mental Model of a System
On Thursday, December 14th we suffered a small incident that lead to various user notifications and actions not being triggered as they would during normal system operations. The issue was caught by alerting so that staff could react prior to customers being impacted, but the nature of the failure and the MTTR (approx 4 hours) was higher than it should have been given the nature of the error and the corrective action taken to resolve it. This seemed like an opportune time to evaluate the nature of the issue with regards to our mental models of how we think the system operates versus how it actually operates. This post-mortem is much more focused on those components of the failure than our typical march towards the ever elusive “root cause”.
Below is a timeline of the events that transpired. After that we’ll go into differnet assumptions made by the participants and how they’re unaligned with the actual way the system behaves.
Timeline
- Datadog alert fires stating that the activity:historyrecordconsumer queue on the RabbitMQ nodes is above thresholds.
- Operator on-call receives the alert, but doesn’t take immediate action
- Second Datadog alert fires at 5:37am for direct::deliveryartifactavailableconsumer-perform
- Operator is paged and begins to diagnose. Checks system stats for any sort of USE related indicators. The system doesn’t appear to be in any duress.
- The operator decides to restart the Sidekiq workers. This doesn’t resolve the issue, so the operator decides to page out to a developer.
- The operator checks the on-call schedule but finds the developer on-call and the backup-developer on-call have no contact information listed. With no clear escalation path on the developer side, the operator escalates to their manager.
- Management creates an incident in JIRA and begins assisting in the investigation.
- Manager requests that the operator restart the Sidekiq workers. This doesn’t resolve the issue.
- Developers begin to login as the work day begins
- Developer identifies that the work queues stopped processing at about 2:05am
- Developer suggests a restart of the Consumer Daemon
- Operator restarts Consumer Daemon
- Alerts clear and the queue begins processing
As you can see, the remedy for the incident was relatively straight forward. But there were a lot of assumptions, incorrect mental models and bad communication that led to the incident taking so long to be resolved. Below is a breakdown of different actions that were taken and the thought process behind them. This leads us to some fascinating insights on ways to make the system better for its operators.
Observations
Some brief context about the observations. The platform involved in the incident has recently been migrated from our datacenter hosting provider to AWS. Along with that migration was a retooling of our entire metrics and alerting system, moving away from InfluxDB, Grafana, Sensu to Datadog.
The platform is also not a new application and precedes the effort of having ProdOps and Development working more closely together. As a result, Operations staff do not yet have the in-depth knowledge of the application they might otherwise have.
Operator on-call receives the alert, but doesn’t take immediate action
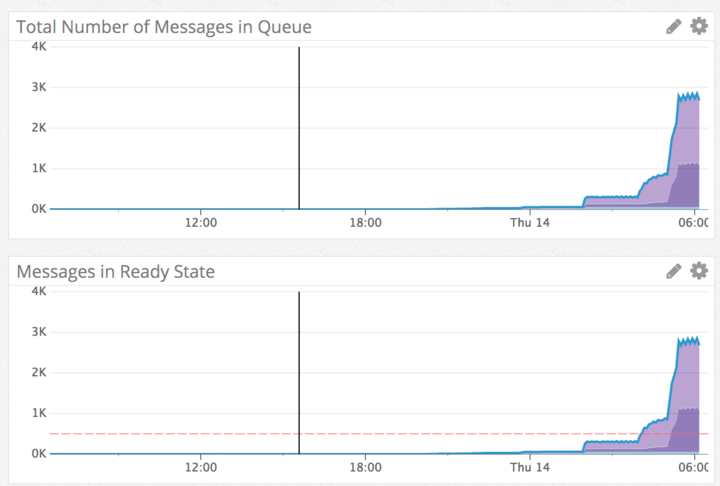
The operator received the page, but noticed that the values for the queue size were just above the alerting threshold. Considering the recent migration and this being the first time the alert had fired in Production, the operator made the decision to wait, assuming the alert was a spike that would clear itself. You can notice a clear step change in the graph below.
We have many jobs that run on a scheduled basis and these jobs drop a lot of messages in a queue when they start. Those messages usually get consumed relatively quickly, but due to rate limiting by 3rd parties, the processing can slow down. In reality the queue that’s associated with this alert does not exhibit this sort of behavior.
Second Datadog alert fires at 5:37am for direct::deliveryartifactavailableconsumer-perform
After this second alert the Operator knew there must be a problem and began to take action. The operator wasn’t sure how to resolve the problem and said a feeling of panic began to sink in. Troubleshooting from a point of panic can lead to clouded decision making and evaluation. There were no runbooks on this particular alert, so the impact to the end-user was not entirely clear.
The operator decided to restart Sidekiq because the belief was that they were consumers of the queue. The operator had a mental model that resembled Celery, where work was processed by RabbitMQ workers and results were published to a Redis queue for notification. The actual model is the reverse. Workers work off of the Redis queue and publish their results to RabbitMQ. As a result, the Sidekiq workers only publish messages to RabbitMQ but they do not consume messages from RabbitMQ, therefore the Sidekiq restart was fruitless.
The Operator began to troubleshoot using the USE methodology (Utilization, Saturation, Errors) but didn’t find anything alarming. In truth, it turned out that the absence of log messages was the indicator that something was wrong, but the service that should have been logging wasn’t known to the operator. (The Operator assumed it would be Sidekiq workers based on their mental model described above. Sidekiq workers were logging normally)
Operator checks the on-call schedule and notices the Developer on call doesn’t have a phone number listed
The Operator checked the confluence page but didn’t have any contact information or any general information on who to escalate to if the contact listed didn’t respond. This is a solved problem with tools like PagerDuty, where we programmatically handle on-call and escalations. Due to budget concerns though we leverage the confluence page. It could be worthwhile to invest some development effort into automating the on-call process somehow in lieu of adding more users to pager duty. ($29 per user)
Management creates an incident in JIRA and begins assisting in the investigation.
Management began investigating the issue and requested another restart of Sidekiq. The manager assumed that the operator was using Marvin, the chatbot, to restart services. The operator however was unsure of the appropriate name of the services to restart. The help command for the restart service command reads
restart platform service {{ service }} in environment {{ environment }}
This was confusing because the operator assumed that {{service}} meant a systemd managed service. We run Sidekiq workers as Systemd services so each worker has a different name, such as int_hub or bi_workers. Because the operator didn’t know the different names, it was much easier to SSH into a box, do the appropriate systemd commands and restart the services.
The disconnect is that {{ service }} is actually an alias that maps to particular application components. One of those aliases is sidekiq, which would have restarted all of the Sidekiq instances including the consumer_daemon, which would have resolved the issue. But because of the confusion surrounding the value of {{ service }}, the operator opted to perform the task manually. In a bit of irony, consumer_daemon is technically not a Sidekiq worker, so it’s also incorrectly classified and could cause further confusion for someone who has a different definition for these workers. The organization needs to work on a standard nomenclature to remove this sort of confusion across disciplines.
Developer identifies that the work queues stopped processing at about 2:05am
When developers began to login, they quickly noticed that the Consumer daemon hadn’t processed anything since 2:05am. This was identified by the absence of log messages in Kibana. This was missed by the Operator for two reasons
- As previously stated, the Operator was unaware that Consumer Daemon was the responsible party for processing this queue, so any log searching was focused on Sidekiq.
- The messages that denoted processing from Consumer Daemon have a much more internal representation. The log entries refer to an internal structure in the code “MappableEntityUpdateConsumer”. But the Operator being unaware of internal structures in the code, would have never correlated that to the behavior being seen. The log message is written for an internal view of the system versus that of an external operator.
Additional Observations
There were some additional observations that came out as part of the general discussion that didn’t map specifically to the timeline but are noteworthy.
activity:historyrecordconsumer is not a real queue
This queue is actually just something of a reporting mechanism. It aggregates the count of all queues and emits that as a metric. When this queue shows a spike in volume, it’s really just an indicator that some other queue is encountering problems. This is an older implementation that may not have value in the current world any longer. It also means that each of our stacked queue graphs are essentially reporting double their actual size. (Since this queue would aggregate the value of all queues, but then also be reported in the stacked graph) We should probably eliminate this queue entirely, but we’ll need to adjust alerting thresholds appropriately with its removal.
Background job exceptions don’t get caught with Airbrake
Airbrake normally catches exceptions and reports them via Slack and email. But background workers (i.e. not Sidekiq) do not report to Airbrake. There have been instances where a background job is throwing exceptions but no action is being taken to remedy.
Fixing the problem vs resolving the incident
Restart the Consumer daemon solved the issue we were having, but there was never any answer as to why every worker node in the fleet suddenly stopped processing from RabbitMQ. The support team was forced to move on to other issues before fully resolving or understanding the nature of the issue.
Action Items
With the observations listed above, we’ve found a few things that will make life easier the next time a similar incident occurs.
- Continue to ensure that our alerting is only alerting when there is a known/definite problem. There’s more value to getting alerts 5 minutes late, but being confident that the alert is valid and actionable. In this case the alerting was correct, but we’ll need to continue to build trust by eliminating noisy alerts.
- Ensure that the On-Call support list has phone numbers listed for each contact. We also need to document the escalation policy for when on-call staff are unavailable. We should also look at automating this, either through expanding PagerDuty or otherwise.
- Marvin chatbot commands need a bit more thorough help page. The suggestion of using a man page like format with a link in the help documentation was suggested.
- Common nomenclature for workers should be evangelized. A simple suggestion is that “workers” accounts for all types of publish/subscribe workers and when we’re talking about a particular subset fo workers we describe the messaging system they interact with. “RabbitMQ Workers” vs “Sidekiq Workers”.
- Support staff need to be afforded the time and energy to study an incident until its cause and prevention are sufficiently understood. We need to augment our processes to allow for this time. This will be a cross-functional effort lead by Prod Ops.